Footprints Tours carbon analysis (Promotion 1 + 2)¹
by Gwendolenn Sharp
This calculation of the Footprints tours, that took place between 2022 and 2023 (Promotion1 and 2), is complementary to the Carbon Impact Study for Jazz Venues and Festivals published in April 2022, continuing to demonstrate the importance of observation and detailed knowledge of impacts in order to establish strategies that are consistent with the realities on the ground.
The choice was made to focus on the mobility of artists (in terms of modes of transport, which accounts for the largest share of emissions). The figures cover 2 years of experimental local touring. With a constant number of concerts (39 for Promotion 1 and 40 for Promotion 2) and a slightly higher number of musicians involved (22 for Promo 1 and 25 for Promo 2), the 6 Footprints tours of Promo 2 weigh 12tCO2e compared with 27,5tCO2e for the 5 Footprints tours of Promo 1.
- Despite a slightly higher number of concerts and musicians involved, the CO2 impact of the 2nd Promo of Footprints tours was 50% lower than the 1st Promo.
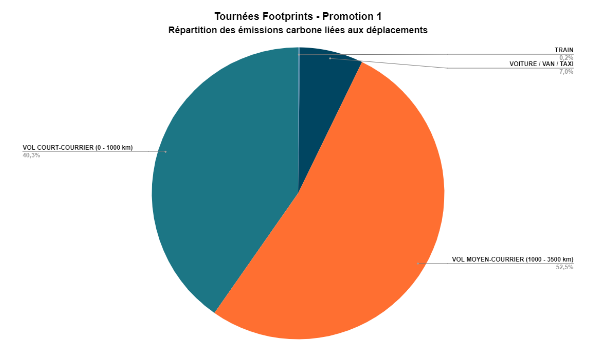
Unsurprisingly, flying accounts for the largest share of emissions.
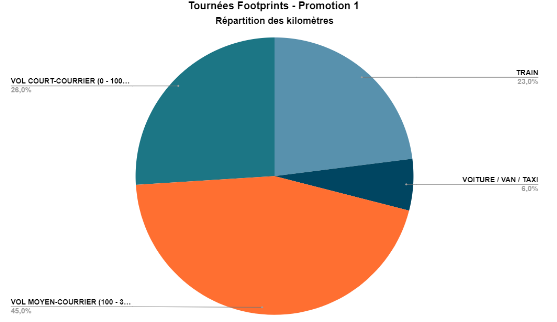
For the 1st Promotion tours, 93,5% of travel emissions are linked to flying, which covers 71% of the total tours’ kilometres (125 000 km).
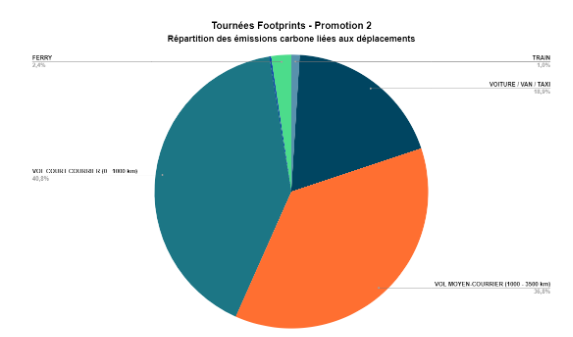
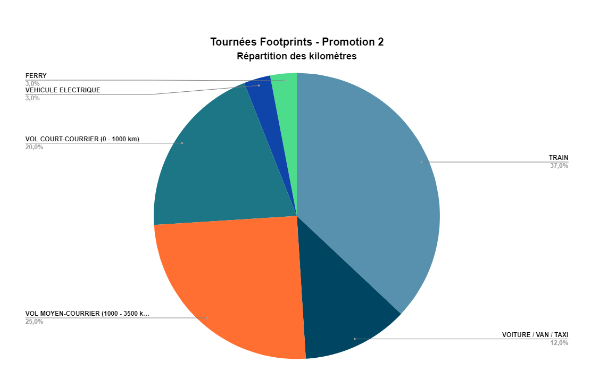
For the 2nd Promotion tours, 78% of travel emissions are linked to flying, which covers 45% of the total tours’ kilometres (44 000 km)
- There’s been a 24% reduction of the CO2 emissions linked to flying between the 1st and the 2nd Promotions.
This significant drop in emissions between the 2 tours can be explained by a sharp reduction in the number of tours involving air travel and by shorter distances travelled by the bands. The total number of kilometres between the 2 years has been cut by almost half (176 000 for Promo 1 vs 96 000 km for Promo 2)
During the 1st Promotion of tours, 4 tours out of 5 involved both medium and short-haul flights, and 1 tour took place only using ground transport. They ranged from 1,5 to 12,6 tCO2e. On average, each 2022 tour included 4 musicians and presented 8 concerts. They covered 35 000 km each (1127 km per musician per concert on average). Each tour emitted 5,5tCO2e on average.
During the 2nd Promotion of tours, 2 tours out of 6 took place only with ground transport, and 2 others used a minimum number of flights. They ranged from 0,2 to 5,7 tCO2e. On average, each 2023 tour included 4 musicians and presented 7 concerts. They covered 16 000 km each (600 km per musician per concert on average). Each tour emitted 2tCO2e on average.
- The impact of Footprints tours ranges from 0.2 to 12.6tCO2e (3.6tCO2e per tour on average).

© Paul Bourdrel
Lessons learned and focus for improvement:
– This focus on the carbon calculation of artists’ travel undoubtedly highlights the weight of air travel. Further data could be collected regarding accommodation and food on tour to have a more precise picture of the various impacts.
– The use of electric vehicles and ferries was marginal on all routes. The figures obtained from calculating their impact are not sufficiently representative to be able to draw any conclusions for the purposes of this study.
– A modal shift from air to rail can have a significant positive impact in mitigating emissions and can be easily put in place to replace parts of connecting flights.
– Favouring train journeys in Europe, where possible, especially as an alternative to domestic and short-haul flights (less than 1000km) has a significant positive impact on mitigating travel emissions. This has to be balanced with the costs and time difference. Clear access maps on different touring routes providing this information could be a useful tool.
– In order to achieve these goals, we need to continue raising awareness among musicians, promoters and agents, and train agents as well as musicians on carbon and environmental issues, in particular on eco-touring.
Gwendolenn Sharp
13th March 2024

¹To reduce the uncertainty of these carbon footprints, data was collected using physical and specific activity data, and emission factors were chosen that were as specific as possible (source: ADEME). However, it should be noted that a degree of uncertainty is inherent in the exercise of calculating carbon emissions.